
Key Figures
ORES and ORES Assets in a few figures
| Operational data | Year 2021 |
|---|---|
| Length of the electricity network | 52.058 km |
| Length of the natural gas network | 10.111 km |
| Total number of points of supply of electricity (Active EANs) |
1.392.186 |
| Total number of points of supply of natural gas (Active EANs) |
522.365 |
| Total quantity of electricity distributed | 12.032.198 MWh |
| Total quantity of natural gas distributed | 15.226.916 MWh |
>
| Social figures | 2021 | 2020 | 2019 | 2018 | 2017 |
|---|---|---|---|---|---|
| Number of active workers (expressed in FTEs) | 2.306 | 2.293 | 2.328 | 2.245 | 2.172 |
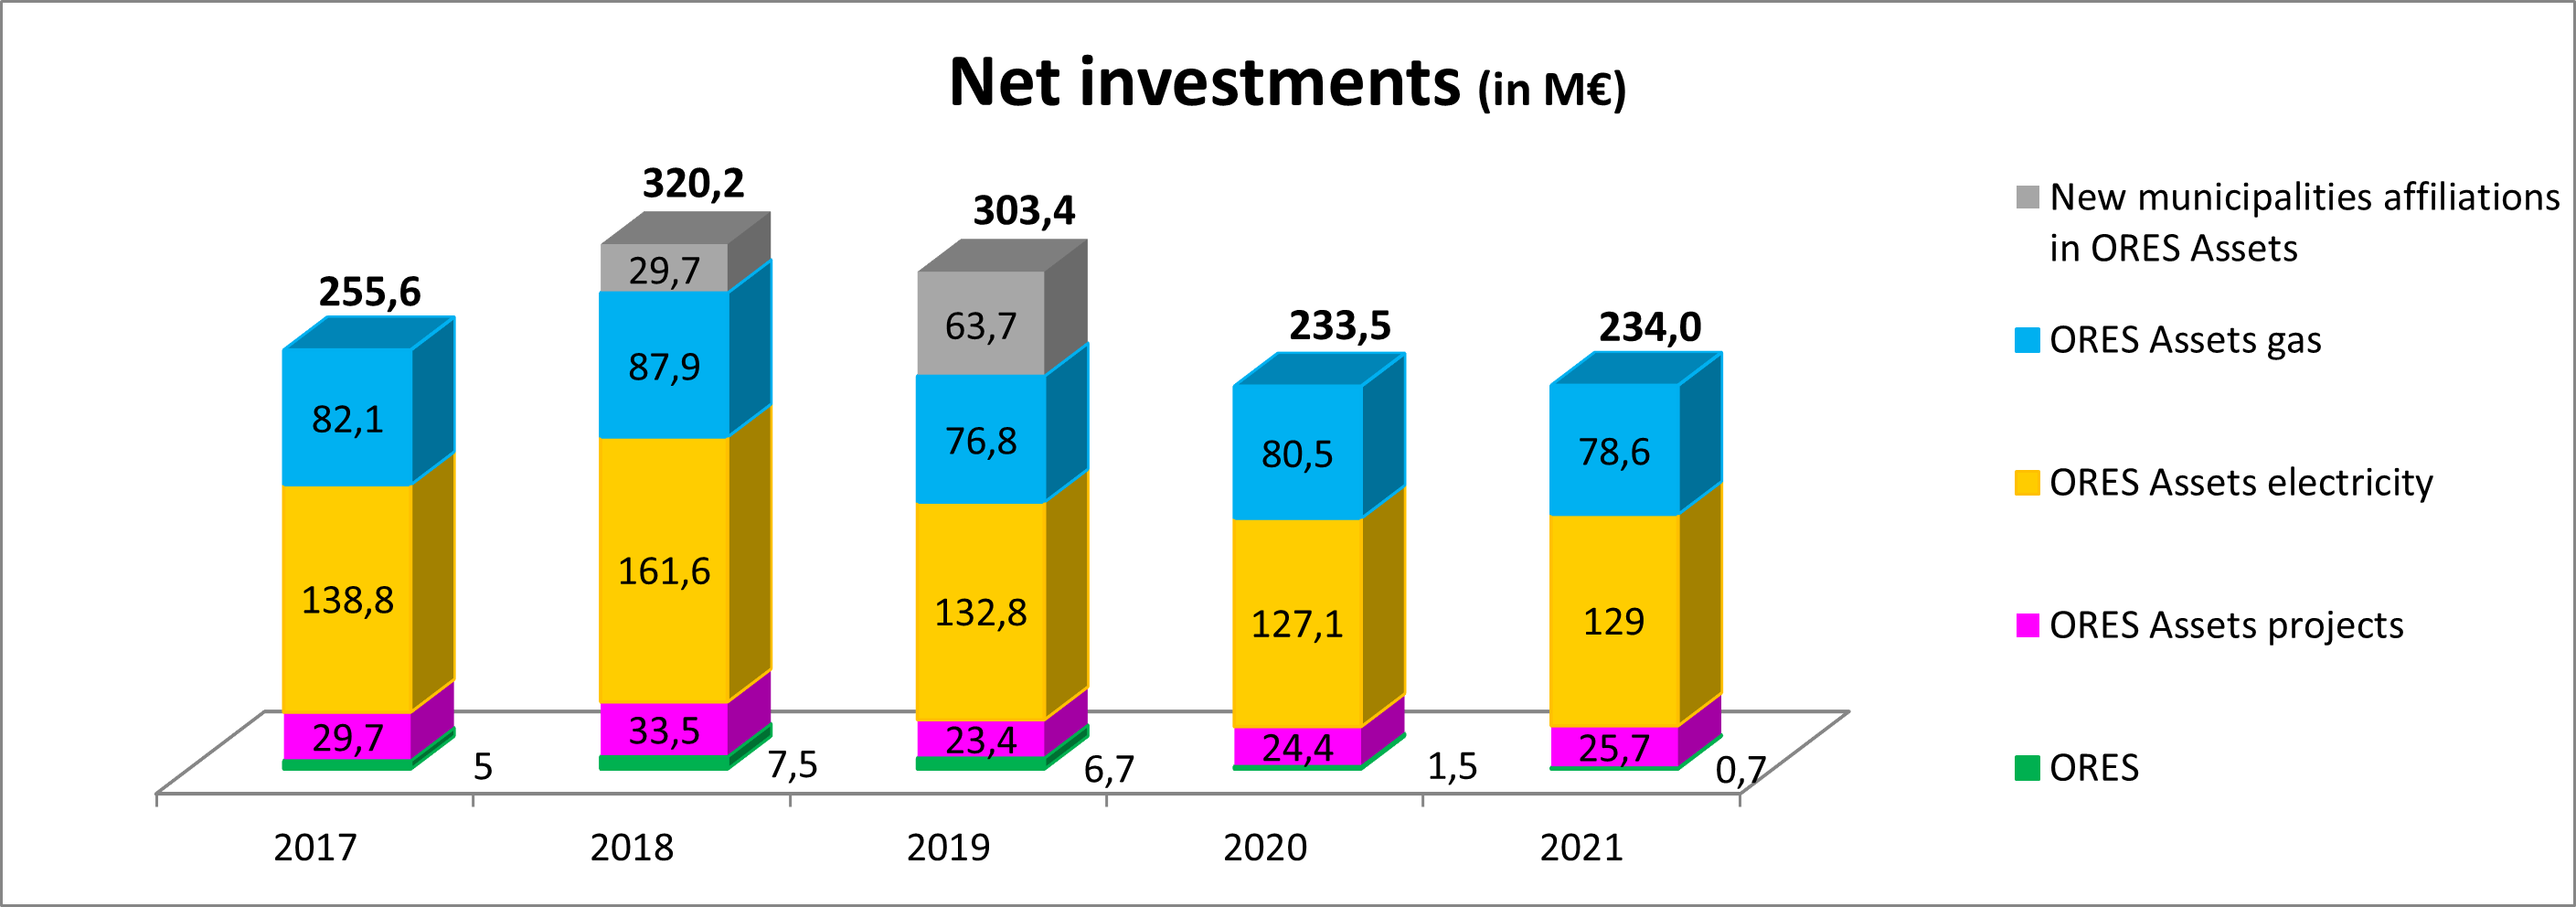
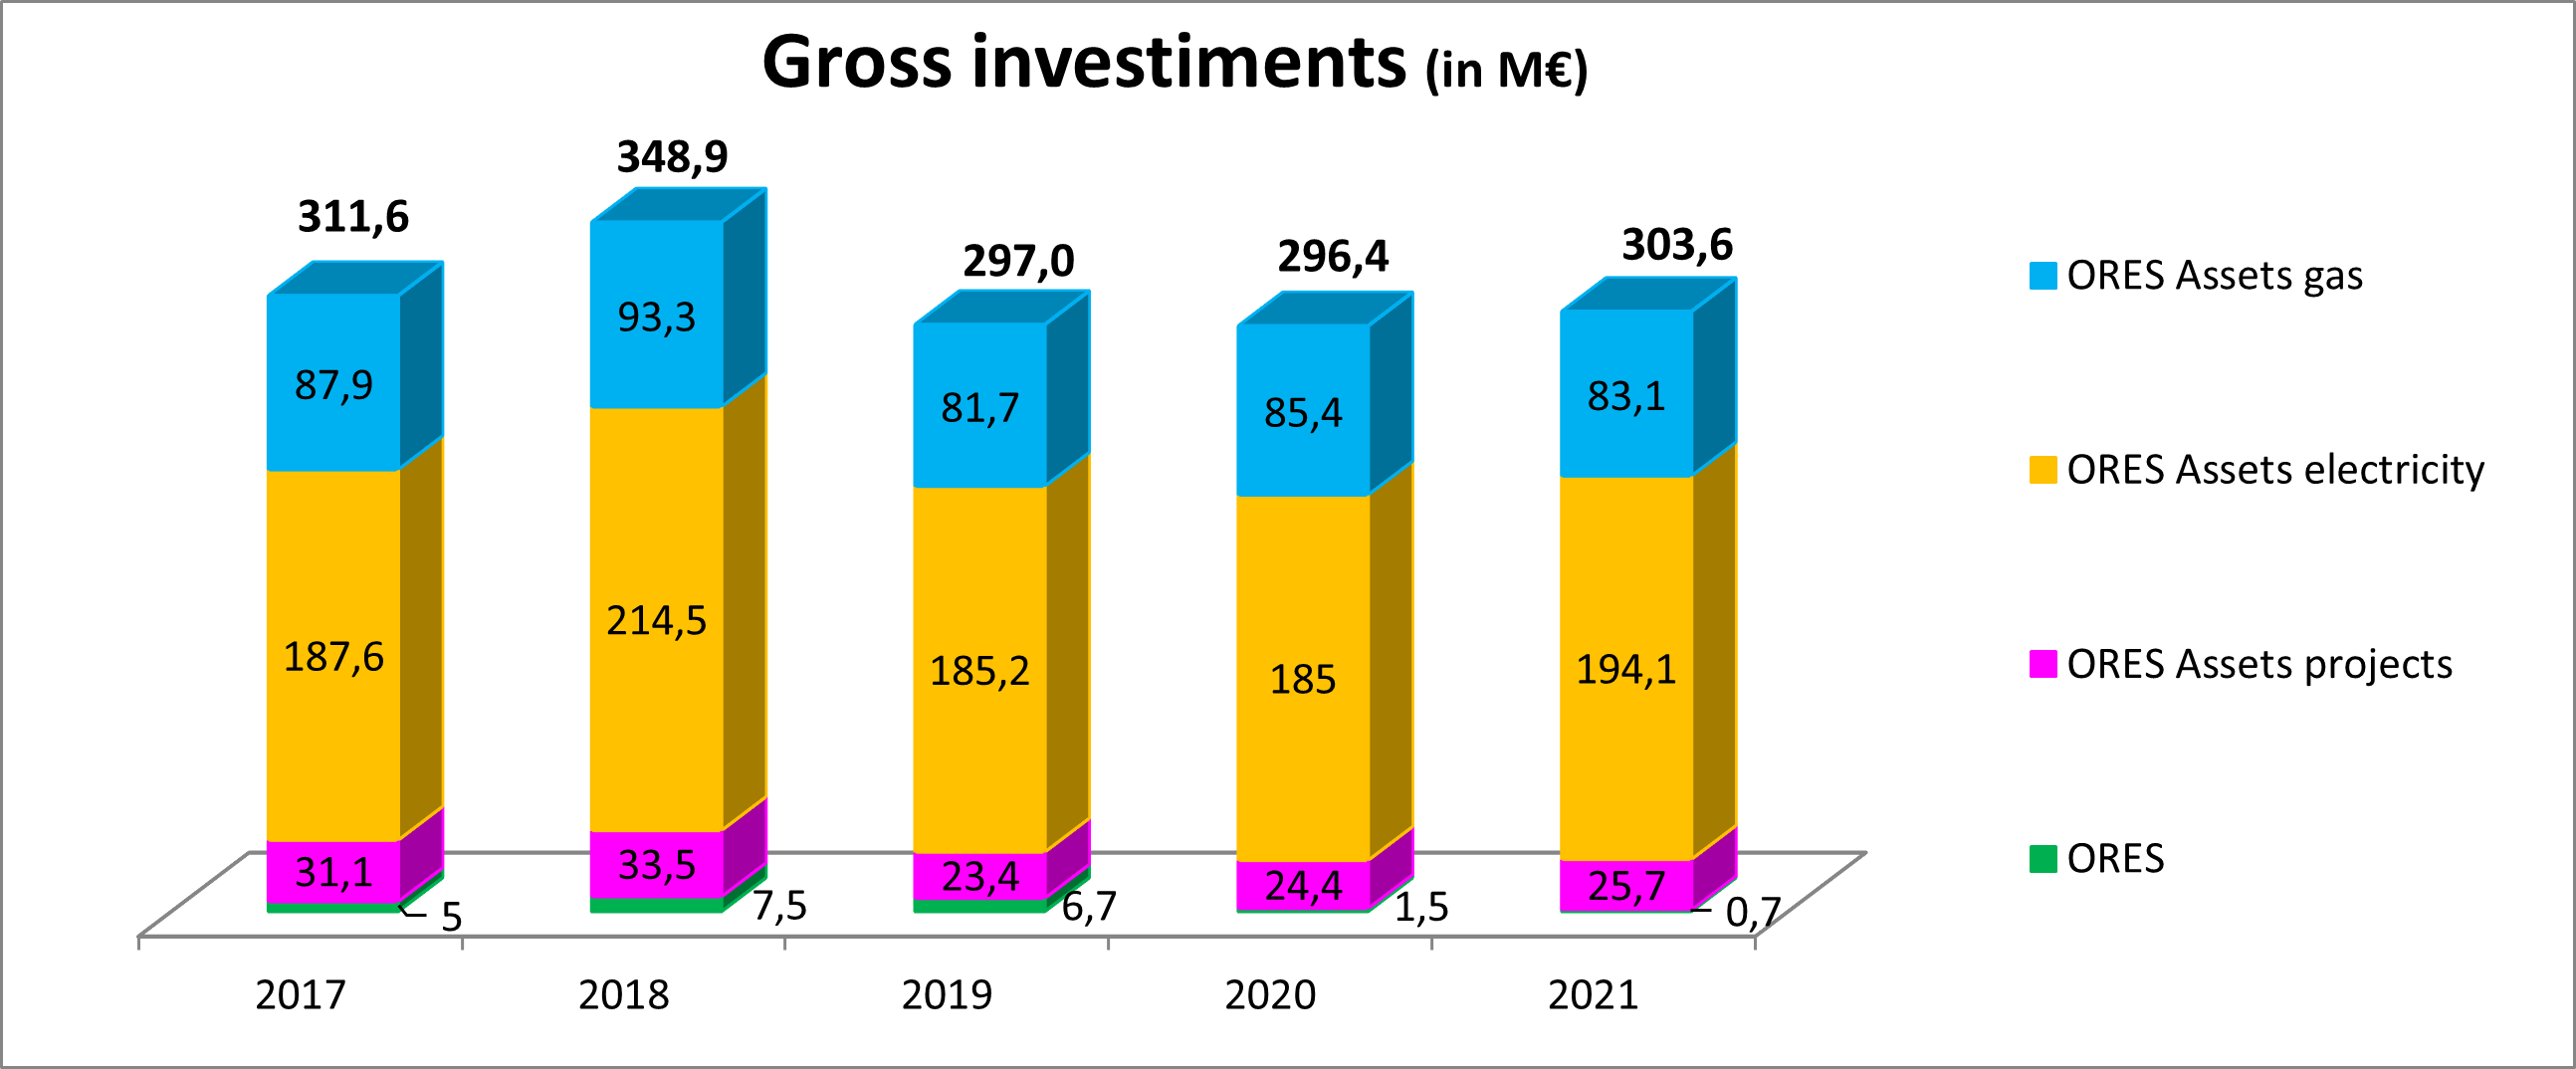
| Investments | 2021 |
|---|---|
| Net investments | 234.0 Mio EUR |
| Gross investments | 303.6 Mio EUR |
*Net investments means the gross investments from which customer interventions have been removed from the investments.
Total investments
Net investments in the electrical and gas networks (in millions of euros)
Gross investments in the electrical and gas networks (in millions of euros)
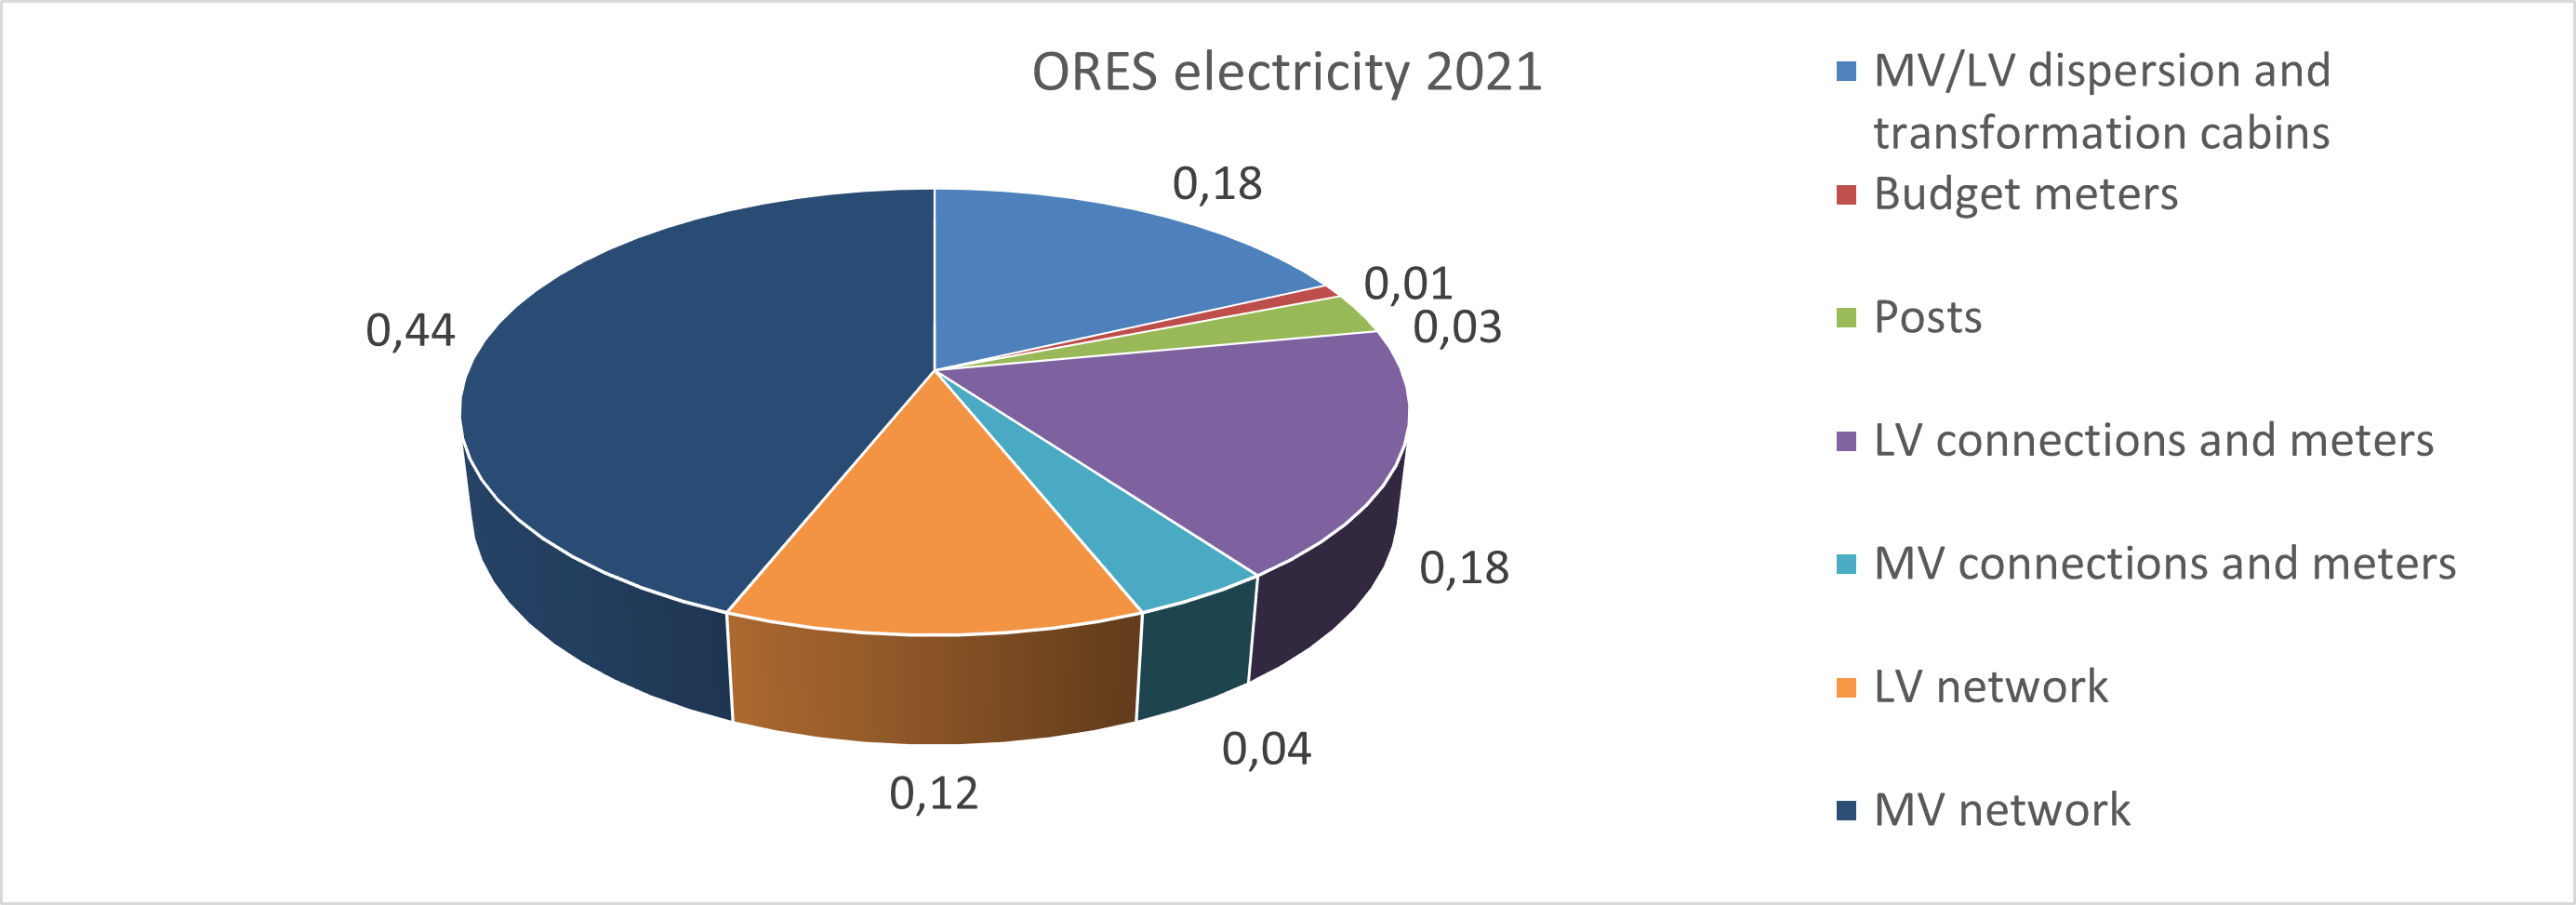
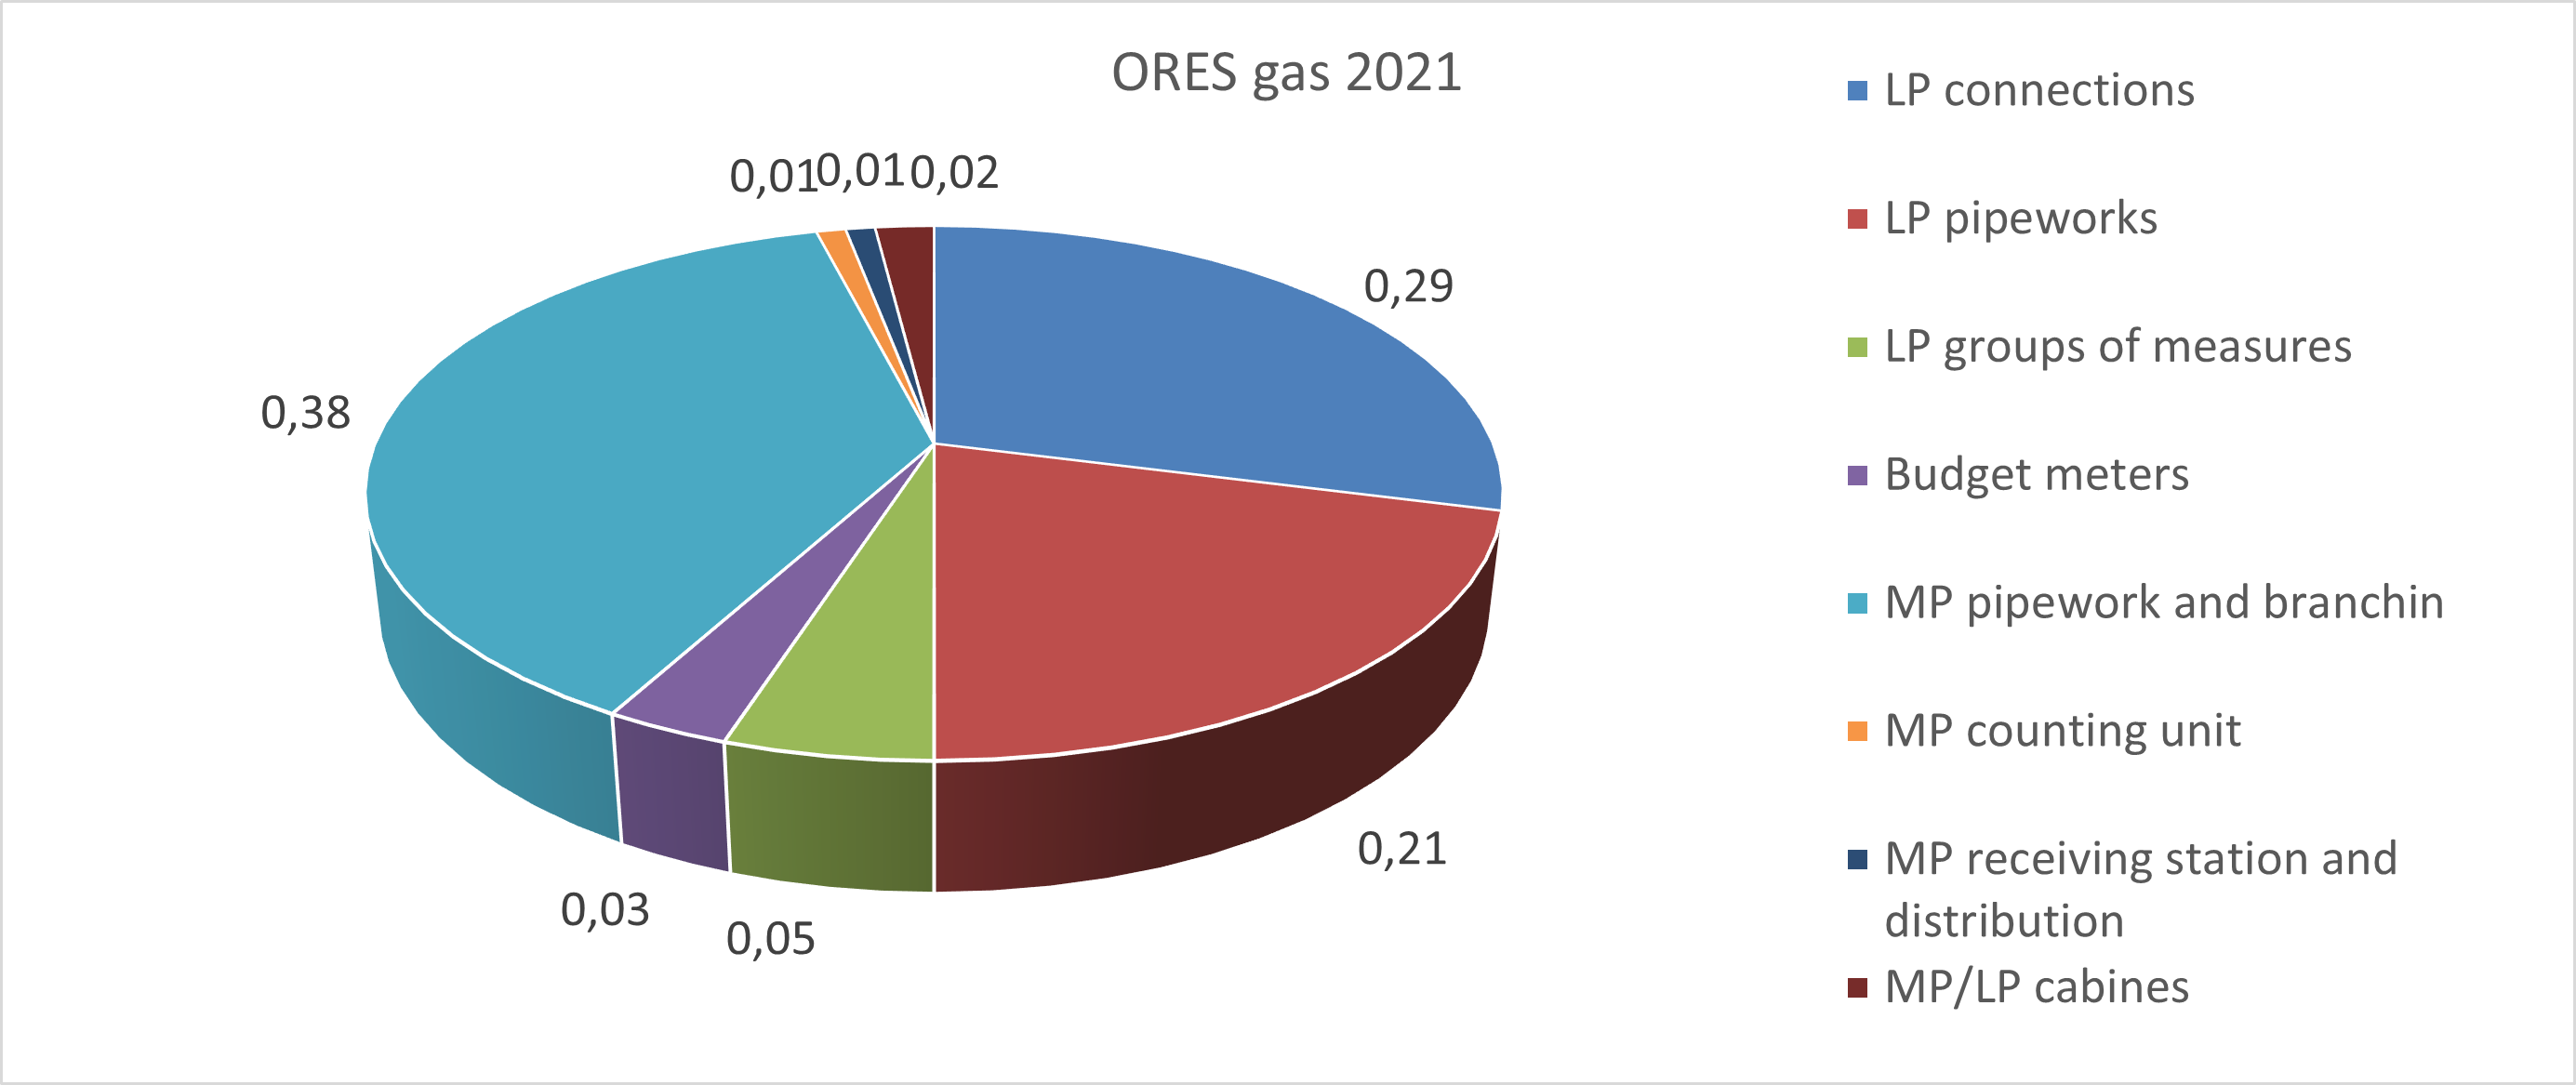
Investment allocation
ORES electricity 2021 Distribution of investments by group of activities.
ORES gas 2021 Distribution of investments by group of activities.
| Financial data | 2021 | 2020 | 2019 | 2018 | 2017 |
|---|---|---|---|---|---|
| ORES’ turnover | 584 Mio EUR | 562 Mio EUR | 548 Mio EUR | 603 Mio EUR | 571 Mio EUR |
| ORES Assets’ turnover | 1.263 Mio EUR | 1.214 Mio EUR | 1.147 Mio EUR | 1.119 Mio EUR | 1.099 Mio EUR |
| ORES total balance sheet | 2.172 Mio EUR | 1.893 Mio EUR | 1.766 Mio EUR | 1.621 Mio EUR | 1.524 Mio EUR |
| ORES Assets total balance sheet | 4.560 Mio EUR | 4.316 Mio EUR | 4.247 Mio EUR | 4.109 Mio EUR | 3.976 Mio EUR |
| Consolidated financial data for the ORES group (IFRS) | 2021 | 2020 | 2019 | 2018 | 2017 |
|---|---|---|---|---|---|
| Operating income (turnover and other operating income, including regulatory balances) | 1.302 Mio EUR | 1.249 Mio EUR | 1.186 Mio EUR | 1.213 Mio EUR | 1.206 Mio EUR |
| EBITDA | 476 Mio EUR | 471 Mio EUR | 409 Mio EUR | 453 Mio EUR | 477 Mio EUR |
| EBIT | 291 Mio EUR | 259 Mio EUR | 200 Mio EUR | 289 Mio EUR | 320 Mio EUR |
| Financial result | -19 Mio EUR | -35 Mio EUR | -48 Mio EUR | -55 Mio EUR | -54 Mio EUR |
| Net profit for the period | 194 Mio EUR | 170 Mio EUR | 99 Mio EUR | 162 Mio EUR | 198 Mio EUR |
| Comprehensive income for the period | 177 Mio EUR | 197 Mio EUR | 99 Mio EUR | 170 Mio EUR | 232 Mio EUR |
| Current assets | 616 Mio EUR | 389 Mio EUR | 396 Mio EUR | 369 Mio EUR | 486 Mio EUR |
| Non-current assets | 4.318 Mio EUR | 4.264 Mio EUR | 4.236 Mio EUR | 4.122 Mio EUR | 3.911 Mio EUR |
| Financial debt | 2.293 Mio EUR | 2.255 Mio EUR | 2.301 Mio EUR | 2.237 Mio EUR | 2.261 Mio EUR |
| Total equity (including regulatory balances) | 1.860 Mio EUR | 1.860 Mio EUR | 1.734 Mio EUR | 1.696 Mio EUR | 1.590 Mio EUR |
| Total balance sheet (without regulatory balances) | 5.017 Mio EUR | 4.737 Mio EUR | 4.674 Mio EUR | 4.565 Mio EUR | 4.463 Mio EUR |
| Total balance sheet (including regulatory balances) | 5.022 Mio EUR | 4.768 Mio EUR | 4.715 Mio EUR | 4.609 Mio EUR | 4.514 Mio EUR |
| Financial ratios B GAAP | 2021 | 2020 | 2019 | 2018 | 2017 |
|---|---|---|---|---|---|
|
Equity ratio/total balance sheet for ORES Assets |
41,90% | 41,69% | 40,44% | 39,69% | 40,20% |
| Equity ratio/total consolidated balance sheet | 40,78% | 40,58% | 38,93% | 38,01% | 37,70% |